When the Market Moves, What Have We Actually Measured?
A first observational probe of the Exposure–Influence Paradox
By Allen R. Jerjiss · Public empirical working draft · November 21, 2026
Public working draft — exploratory, not peer-reviewed, and not a confirmed test of the Exposure–Influence Paradox. This version is shared on The Rising Tide for review and discussion; it has not been finalized or submitted to Medium. The market observations are real and source-tracked, but audience exposure, comprehension, and individual investor decisions remain unmeasured. Source-and-confounder auditing and matched-placebo comparisons remain outstanding.
In The Exposure–Influence Paradox, I proposed a question that sounds deceptively simple: how much can the amount of information in an environment tell us about the effect that information ultimately has on people?
The central proposition was not that information never matters. It was that prevalence is not necessarily proportional to influence on comprehension. One statement may be repeated everywhere but barely understood; another may reach relatively few people and prove consequential. Counting content alone cannot tell us which occurred.
I described five stages worth distinguishing: Content → Exposure → Amplification → Interpretation → Outcomes. The arrows are possible pathways, not guarantees that one stage causes the next. The first article was deliberately a research proposition, not a declaration that a new scientific law had been discovered.
The next obligation is empirical. But an honest first experiment also needs to reveal where the measurement ends.
For that reason, our initial investigation did not begin by pretending we could see inside an audience’s mind. We examined something narrower: documented public statements about a single publicly traded company and the observed trading activity that followed designated event anchors. Financial markets give us time-stamped, measurable outcomes. They do not automatically give us exposure, persuasion, or understanding.
That difference is the point of this first report.
A bounded case: public commentary and Marvell Technology
The initial case, EIP Study 001, examines sourced public comments about Marvell Technology (NASDAQ: MRVL) associated with Jim Cramer, alongside observed U.S. equity market data. It is a convenience case study, not a random or representative sample of all financial commentary, and certainly not a test of the entire information ecosystem.
The existing statement corpus contains 51 sourced statements, grouped using pre-existing event identifiers into 36 documented event groups. After excluding 12 events with anchors outside the regular trading session, 24 events have at least one observed regular-session market-response window. The data gate records these as provider-backed Alpaca SIP one-minute bars, adjusted consistently across MRVL, the semiconductor ETF SOXX, and the broader technology-heavy ETF QQQ.
The measurements are intentionally modest: observed MRVL returns relative to contemporaneous returns in SOXX and QQQ at four nominal horizons: 5, 15, 30, and 60 minutes. The underlying exploratory protocol uses the open of the anchor minute and the close of the endpoint minute. Thus, a “30-minute” window includes trading during its endpoint minute; it is neither an instantaneous reaction nor an estimate of what happened overnight.
These are simple benchmark spreads—not fitted-beta abnormal returns, a randomized experiment, or evidence of a causal communication effect.
The analysis has an additional practical strength and limitation. Its frozen observational baseline contains event-level observations, missing cells, complete provenance fingerprints, and a saved report. The prices themselves remain in a separately held, hashed historical-data cache rather than being redistributed through the publication repository. That makes the derived results inspectable to authorized reviewers, but a fully independent re-run still requires access to the original underlying market observations. At the time of this draft, the underlying research repository is private. Its GitHub links are not yet public evidence citations. Before a Medium release, a separately approved, publicly accessible, redacted supplement must be published without exposing licensed price bars or unrelated private research.
What the first measurements show
The headline result is that average MRVL-relative returns in this selected event sample were positive at each recorded horizon. That is a descriptive observation, not yet an answer to why the moves occurred.
| Horizon | Mean MRVL − SOXX | Mean MRVL − QQQ | Paired events |
|---|---|---|---|
| 5 minutes | +0.509 pp | +0.495 pp | 24 |
| 15 minutes | +0.677 pp | +0.636 pp | 24 |
| 30 minutes | +0.656 pp | +0.560 pp | 24 |
| 60 minutes | +0.479 pp | +0.387 pp | 23 |
“pp” means percentage points of simple-return difference. These are equally weighted means across event groups, not compounded investment returns.
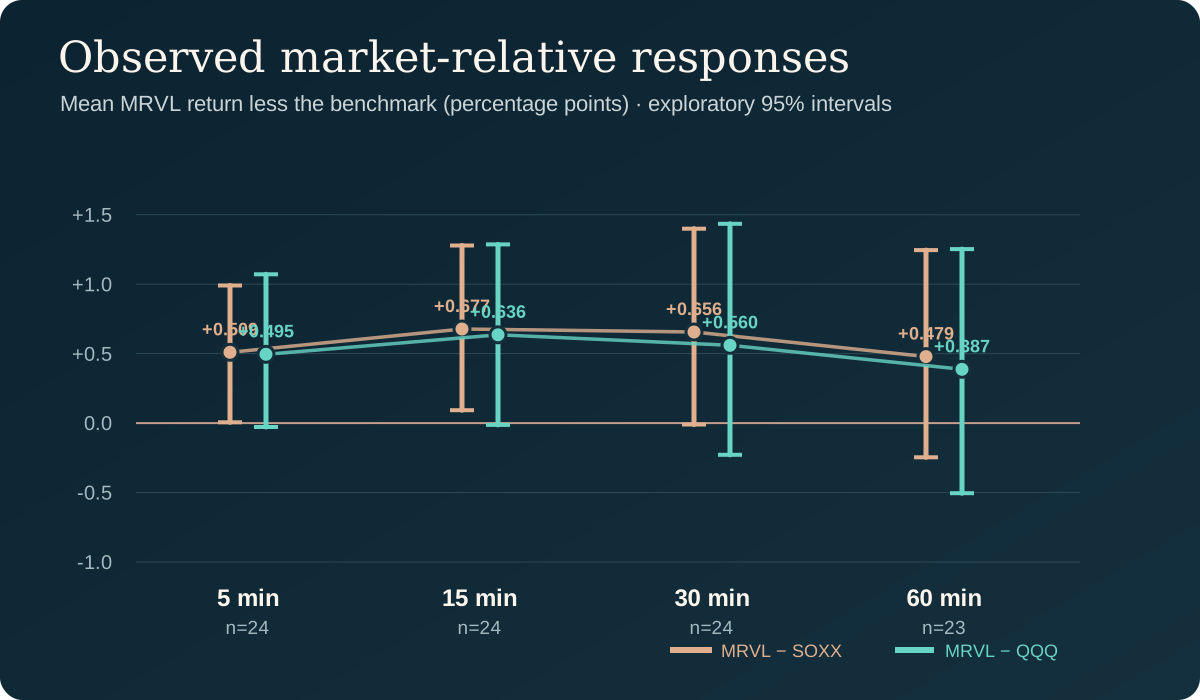
Figure 1. Exploratory event-level mean return differences. The vertical ranges show saved 95% event-bootstrap intervals, not confirmatory tests or causal-effect confidence intervals. Both benchmarks refer to the same underlying MRVL observations and are not independent experiments. Source: Study 001 frozen report.
There are interesting features here. The 15-minute means are larger than the 5-minute means, while the 60-minute means are smaller. The 30-minute mean is +0.656 percentage points relative to SOXX and +0.560 relative to QQQ; at that horizon, 15 of 24 events have positive SOXX-relative spreads and 14 of 24 have positive QQQ-relative spreads. Positive averages coexist with substantial variability and negative observations.
The frozen report includes descriptive percentiles and seeded, 2,000-draw event-cluster bootstrap intervals. For example, the 30-minute SOXX-relative mean has a saved 95% interval of approximately −0.010 to +1.399 percentage points; the QQQ-relative interval is approximately −0.229 to +1.435. Both cross zero. The study was not preregistered as a confirmatory test and examines several horizons and comparisons, so a narrow interval elsewhere must not be converted into a claim of statistical proof.
The proper statement is narrower: the data record market responses; the comparison does not establish that exposure to the commentary caused them.
The distinction that changes the reading of the result
A crucial design choice becomes visible when the events are divided by their timing.
Of the 24 usable events, 19 were tied to after-hours programming and use the following regular-session opening as the return anchor. Only five use other within-session timestamps. Those are not equivalent situations.
At the 30-minute horizon:
| Anchor type | MRVL − SOXX mean | MRVL − QQQ mean | Events |
|---|---|---|---|
| Next-session open | +0.864 pp | +0.760 pp | 19 |
| Other timed intraday anchor | −0.136 pp | −0.202 pp | 5 |
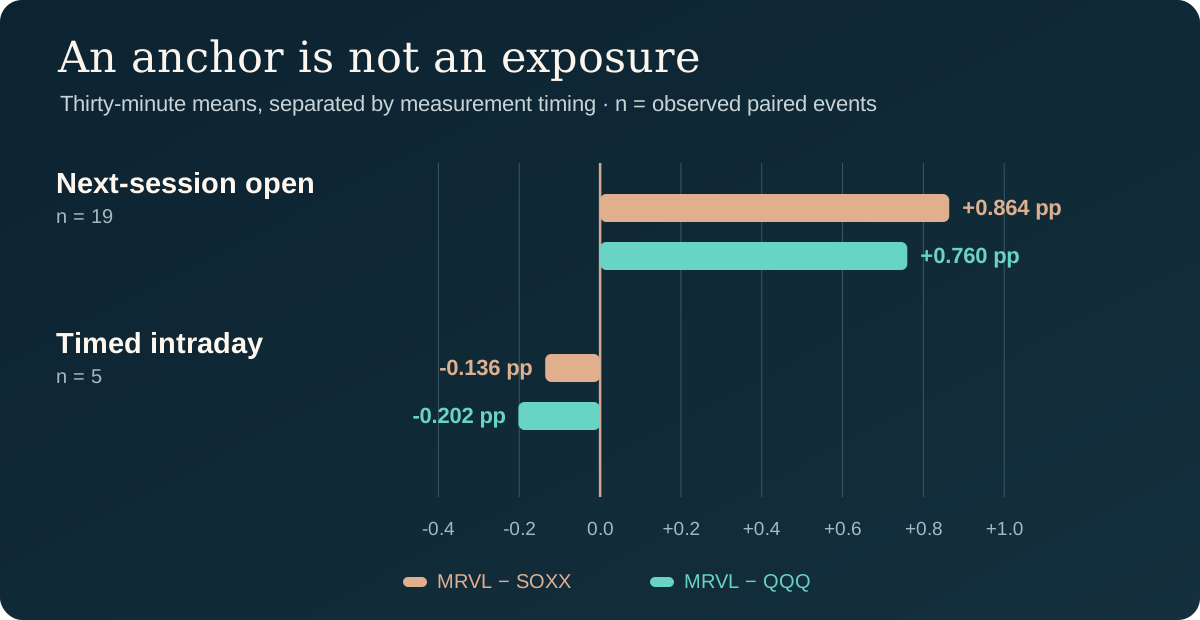
Figure 2. Timing is a competing explanation, not merely a formatting choice. Groups are small, nonrandom and unequal; this contrast has not been assigned a causal p-value.
The positive full-sample mean is concentrated in next-opening windows. Opening trades can reflect earnings releases, corporate guidance, analyst revisions, investor orders accumulated overnight, macroeconomic news, and market microstructure. A return measured from the next day's 9:30 a.m. opening price does not include the prior evening-to-opening gap. It cannot isolate the effect of a television segment broadcast hours earlier.
This split does not mean the commentary had no effect. It means our current design cannot distinguish such an effect from the many other things moving prices at the open.
The five timed intraday observations are too few, and too selectively collected, to settle the alternative hypothesis either. This is a signal to improve the design, not to draw a favorable conclusion from one subgroup or an unfavorable one from the other.
One event illustrates why attribution is so difficult
On September 9, 2026, the event labeled MRVL-044 recorded the largest absolute 30-minute SOXX-relative spread in the retained sample: +5.806 percentage points. Relative to QQQ, the corresponding spread was +7.146 percentage points.
If we looked only at those numbers, it would be easy to tell a dramatic story about commentary moving a stock.
But the underlying event was anchored to the September 9 opening after a September 8 CNBC program that included a Marvell CEO interview. Contemporaneous market reporting, published September 9, describes Matt Murphy presenting materially higher company revenue targets during that appearance. Corporate guidance is an obvious alternative explanation for a large market reaction.
It would therefore be irresponsible to treat this event as a clean measurement of Cramer's personal persuasive influence. Nor can we claim the CEO update was the sole cause without a fuller event study. The correct label is material competing information.
A simple sensitivity check shows how much this event matters:
| 30-minute outcome | All 24 events | Excluding MRVL-044 (23) |
|---|---|---|
| Mean MRVL − SOXX | +0.656 pp | +0.432 pp |
| Mean MRVL − QQQ | +0.560 pp | +0.273 pp |
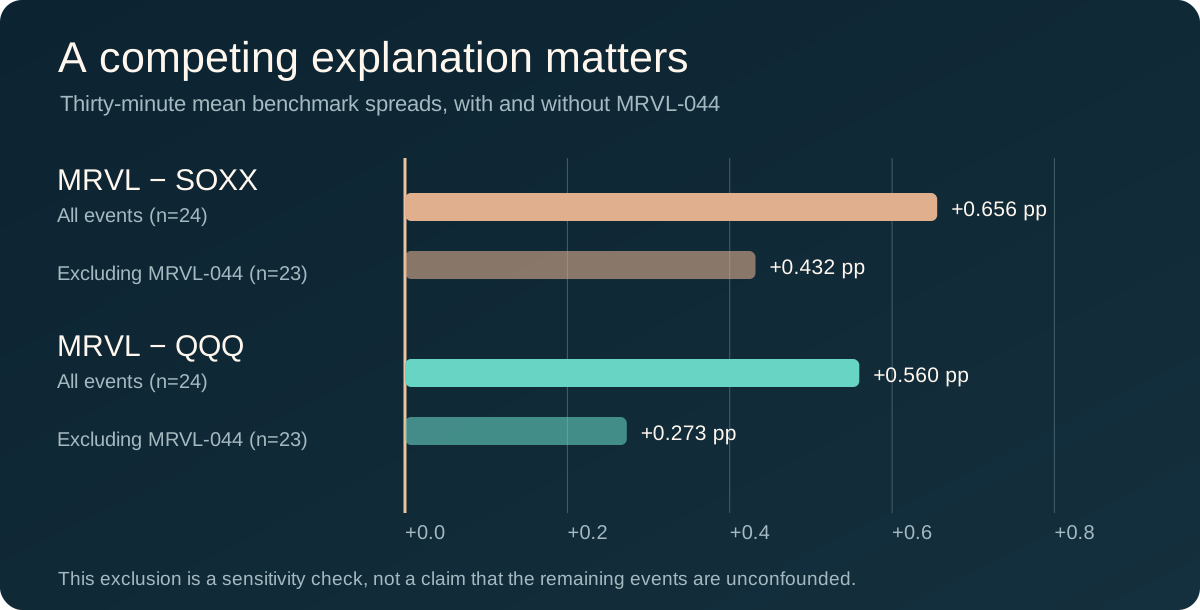
Figure 3. Removing one high-impact, guidance-confounded event reduces both descriptive averages. It does not “clean” the remaining events: the other event groups have not received a complete independent catalyst audit.
This sensitivity is not cherry-picked proof against the original finding. It demonstrates why a result that seems large at first glance requires scrutiny of event-specific context before interpretation.
What the market data do—and do not—cover
Coverage is not the same as validity, but poor coverage can invalidate a comparison before causal questions even begin.
In the committed minute-coverage audit, 285 event × ticker × horizon windows have contiguous observed minute bars between valid endpoints. Another 144 cells correspond to off-session event anchors and were intentionally excluded; three missing endpoints are the MRVL, SOXX and QQQ 60-minute windows for an event anchored at 3:20 p.m. Eastern on November 11, 2025. That nominal 60-minute endpoint would lie beyond the 4:00 p.m. regular-session close. The 60-minute paired sample is therefore 23 rather than 24, not 24 with a fabricated zero.
The program also calculates a crude post-/pre-window trading-volume ratio where a valid preceding same-day window exists. Those comparators are available for only five, four, three, and one event(s) at the 5-, 15-, 30-, and 60-minute horizons, respectively. They are not adjusted for intraday volume seasonality. At the 9:30 a.m. opening, no preceding same-session regular-minute window exists, so an absent ratio cannot be interpreted as no trading or no audience interest.
These details matter because volume is not viewership. Neither a return nor a trading-volume spike tells us who saw a message, what they believed before it, or whether they acted after encountering it.
Put the five stages back into the picture
The Exposure–Influence Paradox was proposed to separate mechanisms that are often collapsed into one number. Study 001 gives us a useful opportunity to ask which of those stages this case actually observes.
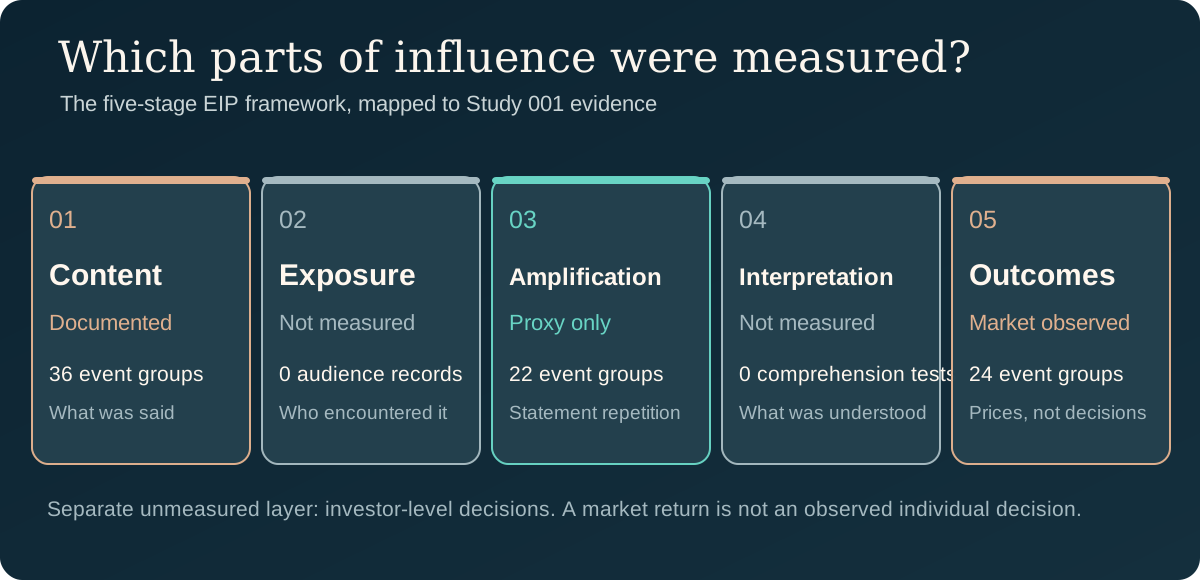
Figure 4. Measurement coverage, not a progression of proven effects. The study records 36 documentary event groups and 24 market-response events; it has a limited statement-repetition proxy for amplification. Audience exposure, interpretation and individual investor decisions were not measured.
Content: We have sourced statements and event-group metadata. This documents what was said in the collected corpus—not everything said across all channels.
Exposure: We do not have audience-level views, impressions, listening records, or a verified first-exposure timestamp. A television broadcast time is not equivalent to the moment a particular person encountered a statement.
Amplification: A recorded seven-day repetition count exists as a source-level proxy for 22 event groups. It does not measure the number of people reached, the intensity of engagement, or the meaning they derived.
Interpretation: We have no measurements of understanding, perceived credibility, belief change, or comprehension.
Outcomes: We observe market returns for 24 eligible event groups. We do not observe the investor-level decisions that might have produced those prices, nor can we attribute aggregate price changes to a particular message.
The original research question asked whether models using measured exposure and audience information can better explain changes in comprehension than prevalence-based models. This particular study does not compare those two kinds of models. It does not yet test the central EIP hypothesis. That distinction is essential to reporting the empirical work with integrity.
What this first empirical step contributes
At this point, the strongest contribution is not a claimed Cramer effect and not a validation of EIP. It is a transparent measurement boundary.
We can show that a source-linked set of public statements can be connected to verifiable market observations, with documented event grouping, benchmark comparisons, excluded windows, and inspectable artifacts. We can also show precisely where an appealing causal narrative outruns the evidence: next-session anchors, corporate news, a high-impact confounded observation, and entirely missing audience and comprehension layers.
That is an informative result even if later matched controls shrink the averages toward zero. A carefully executed negative or ambiguous result would be more valuable to the framework than a favorable but unsupported causal claim.
The initial study also teaches us something practical: adding two benchmark tickers is not the same as adding evidence about the people who encountered the information. Better prices alone cannot repair missing exposure and interpretation measurements.
The next empirical design
Before treating the market-response comparison as strong evidence of a communication effect, we need to:
- Audit catalysts event by event. Earnings, guidance, customer announcements, analyst changes and broader market news must be coded against the event windows. The remaining groups cannot be assumed confounder-free.
- Create time-matched placebo windows. Compare the observed next-open and timed-intraday returns against non-event sessions with matched timing and market conditions. The current report contains no accepted placebo distribution.
- Preserve the timing distinctions. After-hours-to-open, within-session statements and overnight gap returns require distinct designs. Combining them can conceal rather than resolve confounding.
- Measure actual exposure and comprehension. If the goal is to test EIP rather than market co-movement, collect consented reach/encounter data and pre-/post-exposure understanding outcomes.
- Pre-register the decisive comparison. Evaluate a prevalence-only model against exposure-aware and audience-sensitive alternatives on a held-out sample with a defined primary outcome, corrections for multiple testing, and transparent power and selection limits.
- Replicate independently. Reconstruct source timestamps, review article figures at publication size, reproduce results from licensed raw market data, and publish the audit trail—including null results.
These are not editorial niceties. They separate an exploratory observation from a defensible test.
A more careful conclusion
A stock can move dramatically after a widely visible statement. That does not tell us how many people actually saw the statement, how they understood it, or whether it mattered more than competing information released at the same time.
The first Exposure–Influence Paradox article asked us not to mistake information prevalence for understanding. This initial empirical case asks us to apply the same discipline to our own research: do not mistake a measurable outcome for a measured mechanism.
We have started to measure the space around the question. We have not yet answered it.
And that is where the next study begins.
Methods, provenance, and source notes
Primary research source: EIP Study 001, frozen observational-v1 baseline and its event-level report. The exploratory protocol describes source grouping, observed-bar alignment, the return convention, missing-data rules, and seeded exploratory bootstrap. The validation ledger records owner-executed integrity and regression checks, not independent peer review.
Conceptual predecessor: The Exposure–Influence Paradox, Allen R. Jerjiss, Data Science Collective, October 21, 2026.
Documented competing-information event: CNBC's September 8, 2026 CEO interview and September 9 contemporary market reporting. These sources establish an important confounder, not a definitive allocation of the price move among causes.
Data scope: Curated public statements and bounded, read-only Alpaca SIP one-minute market bars. No individual-level audience, trade, belief, or comprehension data. Prices are adjusted consistently across MRVL, SOXX and QQQ; source files are hashed and held separately.
Status at draft creation: Verified observational baseline; supplemental technical review and broader confounder/placebo validation outstanding. This draft is not a publication-ready causal EIP result.
Evidence access: The underlying research repository is currently private, so its GitHub references are not publicly accessible citations. The numerical observations above are presented transparently as an exploratory working draft. A redacted public evidence supplement, independent replication, and further controls remain necessary before final Medium publication.